Study on engagement in Social Media Marketing

Over the past few years, the way businesses utilize social media has significantly evolved. Most now recognize that social media is a two-way channel and understand the importance of engaging with their audience. However, only a few businesses have truly mastered the art of growing their business through social media.
Many businesses continue to struggle with determining the most effective ways to use social media. There are valuable insights to be gained from studying companies that have successfully leveraged social media to drive growth. By examining these high-performing businesses, marketers across all industries can learn and improve their social media strategies.
To ensure these findings are industry-neutral and broadly applicable, a large sample size was used: the Facebook and Twitter accounts of over 30,000 businesses were analyzed. The analysis revealed that many businesses approach social media in a similar way to email marketing. However, the tactics that have traditionally worked with email marketing often yield mediocre or no results when applied to social media marketing.
Social media functions at the top of the marketing funnel, introducing prospective customers to a brand or product for the first time. In contrast, email marketing comes into play later, when a prospect is already familiar with a brand and has provided their email address to stay connected. Additionally, social media is a public, two-way channel that encourages discourse and sharing, while email remains a private, one-to-one communication method. One of social media's greatest strengths is its potential for viral reach, allowing messages that resonate with an audience to be easily shared and spread.
Understanding which messages resonate requires experimentation, followed by analysis to identify the types of content that generate the most engagement and shares. However, even before diving into experimentation, there are clear lessons to be learned from businesses that are successfully utilizing social media as a growth tool.
Success Metrics

With the ability to purchase thousands of fake followers or fans for a relatively low cost, most marketers have come to understand that follower count is a poor metric for measuring success on social media. This realization is further supported by the findings of recent studies, which highlight instances where companies boast thousands, or even hundreds of thousands, of followers but receive little to no engagement from them.
What truly matters is the level of engagement from followers. The key indicators of success are not the number of followers, but how these followers interact with the brand on social media. Are they sharing the content? Are they liking and commenting on posts? Engagement metrics such as Retweets, Comments, Shares, and Likes are more accurate measures of whether a post is resonating with the audience and whether the brand is fostering meaningful connections.
The engagement metrics consists of three important parameters:
- Likes: Like on Facebook post(s) gives the measure of appreciation towards content posted
- Comments: Commenting on the content you posted is even a stronger sign of engagement compared to Likes
- Retweets/Shares: Number of retweets or shares helps in measuring how far your message will spread beyond its immediate audience. For the right content that gets shared again and again, this is akin to getting the holy grail of marketing right the word-of-mouth effect
Distribution by weekday
Facebook Likes
Posts on facebook published during weekends generate more likes compared to rest of the weekdays.
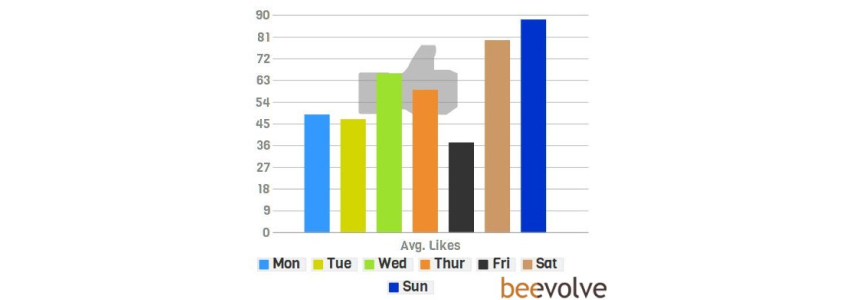
On an average a post on Sunday and Saturday generate more applause compared to weekdays.
Social media posts on weekends generate more Facebook Likes and Retweets compared to weekdays
Saturday and Sundays generate around 79 and 88 average number of likes respectively followed by Wednesday with 66 average likes.
Least likes are generated on posts published on Friday with mere 37 likes on average.
So, if you are looking for more likes and applause make sure you launch your campaign on weekends or Wednesday.
Retweets
Pattern observed with average number of retweets is very similar to Facebook likes. Tweets posted on weekends and Wednesday have more number of retweets on average as compared to rest of the weekdays. Yes indeed results are interesting when two different social media channels are compared.
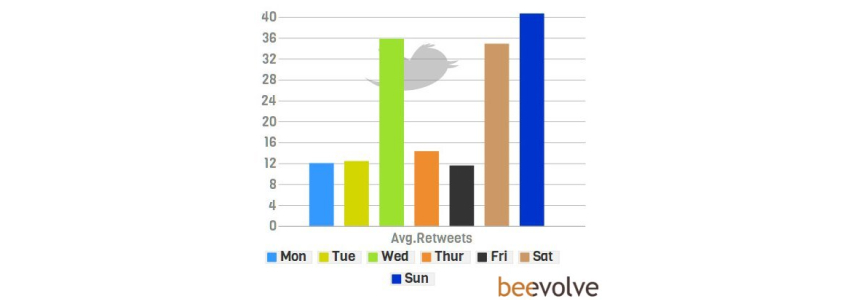
Tweets posted on Saturday and Sunday generates 35 and 41 retweets on average
Tweets posted on Wednesday have 36 retweets on average which is 3 times compared to rest of the weekdays
If you are looking for more amplification of tweets among followers and follower of followers make sure you launch your campaign on weekends or Wednesday.
Facebook Comments
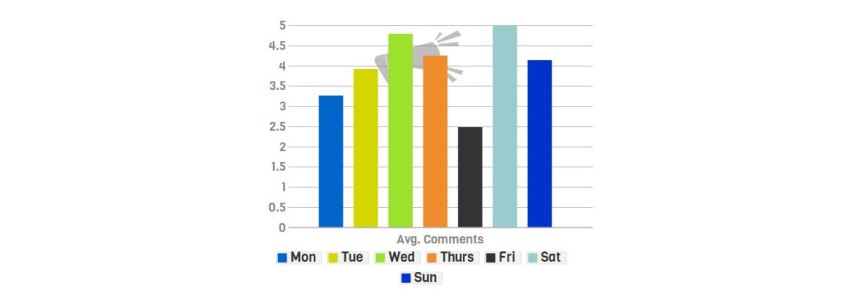
No doubt comments provides another level of engagement with the content posted on social media. Although trend here for the posts is similar to number of 'likes'.
Maximum conversation rate is observed on Saturday followed by Wednesday and least on Friday.
Effect of different Content Types on Social Sharing
'A picture/video speaks a thousand words' is certainly true when it comes to social media sharing. When posting on social media type of content matters, but upto what extent?
For Facebook posts, content is classified as following:
- Photos - If pictures are used to convey the message
- Videos - If the embedded video forms the core message
- Text Status - If its normal text without any video or image
- Shared Story - If a story published by somebody else is shared
Facebook Likes
Photos generate more applause, videos are effective in engagements (comments).
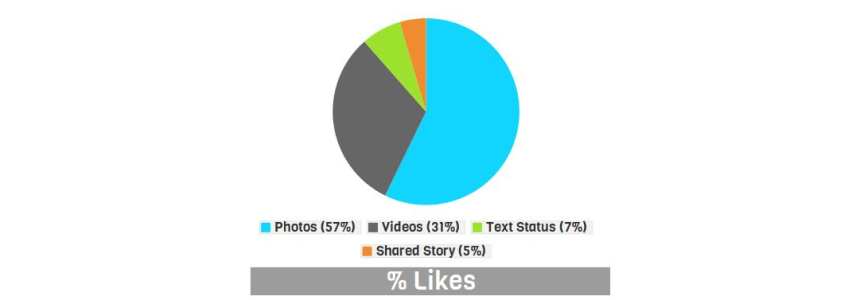
57% of likes for the posts with pictures used.
31% of likes were found associated with posts with video content.
No wonder picture and videos have different impact on your audience and helps to convey message much more effectively. And these numbers are enough to prove it.
Facebook Comments
When it comes to conversation rate with content social media audience engages more with multimedia content and especially videos.
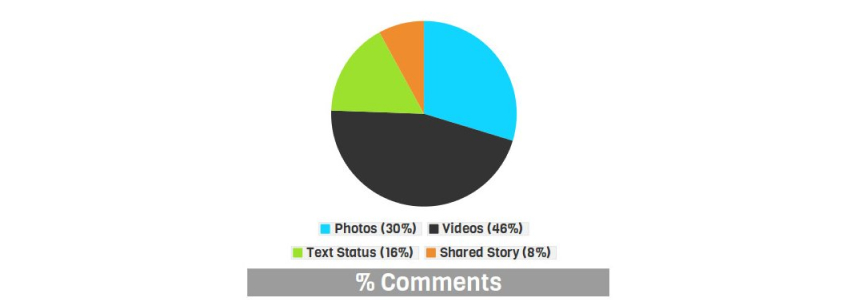
46% of comments are generated from the posts with videos while 30% of comments are generated from posts with pictures.
Status updates and posts without any multimedia content generates only 24% comments on facebook.
Best Time of the Day for Social Sharing
We compared social media metrics with time, to understand significance of time of the day on the post. No doubt engagement on the tweet/post is dependent on geographic location. Following graphs display relation between hour of the day and social media metrics. Spikes observed in the graphs are not only interesting but also gives insight into audience activity around the globe using social media channel.
Facebook Likes
Following is the table with local time of countries corresponding to favorable time(GMT). This might come in handy when one is planning to launch social media campaign.
| Country | 23 Hour | 21 Hour | 17 Hour | 1 Hour |
|---|---|---|---|---|
| United States | 7PM | 5PM | 1PM | 9PM |
| United Kingdom | 12AM | 10PM | 6PM | 2AM |
| Australia | 9:30AM | 7:30AM | 3:30AM | 11:30AM |
| Canada | 8:30PM | 6:30PM | 2:30PM | 10:30PM |
| Brazil | 9PM | 7PM | 3PM | 11PM |
| India | 4:30AM | 2:30AM | 10:30PM | 6:30AM |
With the expert opinion from our friends:
Popular Tweets
Connect with us during #CannesLions2024 to learn more about how X is bringing it all together in an open marketplace for ideas, conversation and commerce that accelerates self-expression for all. pic.twitter.com/HhsSegxzQp
— Business (@XBusiness) June 10, 2024